Graphing software
description to come
Graph
Graph is a graph plotting software. It allows you to plot standard 2D functions (y = f(x))and inequalities, as well as areas under a curve, and tangents to curves (it will also tell you the equation of the tangent).
It also allows you to plot individual data points (or a series of data points), trace curves, calculate the length of a path on a curve, plot parametric and polar functions.
It also has a few other features which I haven't used, so I can't comment on these.
Overall it has great functionality and is very easy to use.
graphing 2D surfaces in 3D
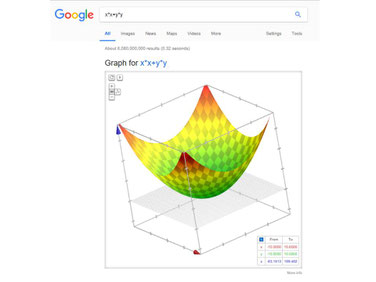
There are some free software packages which plot 2D surfaces (WinPlot below being one of them), but if you want a good quality plot, which you can rotate, without the need for any other functionality, then do this:
- go to Google
-
type in you function in the search bar.
E.g. x*x + y*y
SingSurf
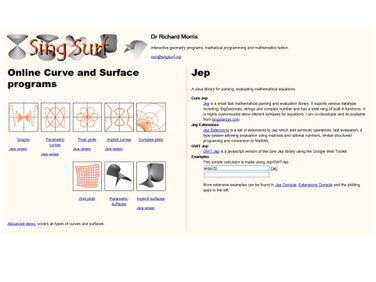
SingSurf is a multi-plotting software. Amongst other things it allows you to graph normal y = f(x) curves,
parametric curves, polar curves, implicit curves, complex valued functions, grid plots and surface plots.
WinPlot
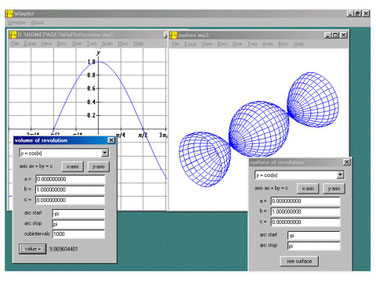
Description to come.
Click the image to go there.
GeoGebra animations
Description to come.
Click the image to go there.
GeoGebra software
Description to come.
Click the image to go there.
Mathematica animations
Description to come. Click the image to go there.
Software for Mathematica animations
Description to come. Click the image to go there.
Veusz Scientific Graphing
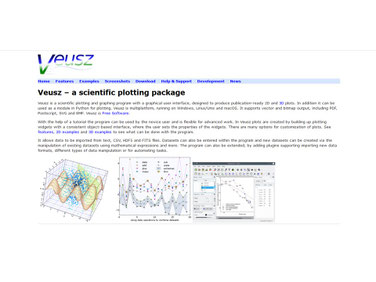
Veusz is an excellent freeware scientific graphing software which can plot 2D and 3D functions. It does standard y=f(x) plots, parametric plots, multivalued
functions, contour plots, vectors fields, box plots, bar charts, histograms, operations on data sets, fitting curves to data, amongst other things. It also allows for broken axes, multiple axes
of different scale, stacked plots.
Maths 3D
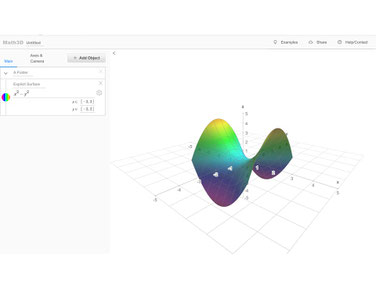
An excellent online 3D plotter. It can plot explicit and implict equations, surfaces, parametric curves, and vector fields. You can rotate the axes very easily and efficiently. Highly dynamic and responsive.